Why Traditional SEO Metrics Are Failing You
If your SEO reports still lead with keyword rankings and organic traffic, you are measuring a version of search that no longer exists. Nearly 60% of all searches now end without a single click to any website, according to Semrush research from 2025. Google's AI Overviews appeared in just 6.49% of queries in January 2025 — by March, that figure had doubled to 13.14%. When AI Overviews are present, the zero-click rate jumps to approximately 83%.
This is not a temporary blip. It is a structural shift in how people find and consume information through search engines. For UK businesses investing in organic search ethical search optimisation, the question is no longer "are we ranking?" but "are we generating measurable business value from search visibility?"
The answer requires a fundamentally different approach to SEO analytics and reporting — one that accounts for zero-click behaviour, measures engagement quality over traffic quantity, and connects search performance directly to revenue. This guide covers exactly how to build that framework.
Key Takeaway
Traditional SEO metrics like rankings and traffic volume now capture only a partial picture of search performance. With 58.5% of searches producing zero clicks and AI Overviews expanding rapidly, UK businesses need analytics frameworks that measure visibility, engagement quality, and revenue attribution tracking marketing ROI — not just clicks.
58.5%
Zero-Click Searches
US searches ending without a click (2025)
13.14%
AI Overview Queries
Google queries showing AI Overviews (March 2025)
39.8%
Position 1 CTR
Average click-through rate for top organic result
£16.9B
UK Search Ad Spend
Annual UK search advertising market (2024)
Sources: Semrush 2025, FirstPageSage May 2025, Advertising Association/WARC 2025
What Has Changed in the SEO Measurement Landscape?
The shift from clicks to value has been building for several years, but 2025 marked the tipping point. Three forces converged to make traditional SEO measurement frameworks unreliable: the explosion of zero-click searches, Google's aggressive AI Overview rollout, and the mandatory migration to Google Analytics 4.
The Zero-Click Reality
Semrush's 2025 analysis found that 58.5% of US searches and 59.7% of EU searches conclude entirely within Google's results page. Mobile searches are particularly affected — 77.2% of mobile queries end without a click, compared to 46.5% on desktop. This means that for informational content (the largest category of search behaviour), your content may be visible and valuable to searchers who never appear in your analytics.
The impact is not uniform across all search types. AI Overviews disproportionately affect informational queries, with approximately 88.1% of queries triggering AI Overviews being informational in nature and only 1.43% being navigational. For UK businesses operating in professional services, financial services, and health and wellness — sectors that rely heavily on informational content — this represents a fundamental challenge to measurement approaches.
The AI Overview Disruption

When Google displays an AI Overview for a query, the dynamics change dramatically. Research shows that approximately 70% of users read only the opening section of AI Overviews before making decisions, and when a brand's content is cited within an AI Overview, the click-through rate to that source averages just 1%. This creates what analysts have termed "The Great Decoupling" — search volume continues to rise, yet clicks to websites decline. The median publisher experienced a 10% year-over-year decline in organic traffic during the first half of 2025, with non-news content sites seeing declines of up to 14% despite maintained or improved search visibility.
For SEO reporting, the implication is clear: a page can be performing well in terms of visibility and authority whilst showing declining traffic in Google Analytics. Without understanding this context, stakeholders may incorrectly conclude that SEO is underperforming.
GA4 Adoption and Measurement Differences
Google Analytics 4 adoption among UK marketing professionals reached 61% by January 2026, up from just 23% in mid-2023. However, adoption does not equal accurate implementation. GA4's fundamentally different event model means that configuration errors — incorrect event naming, missing conversion definitions, improperly configured audiences — systematically degrade data quality. For UK SMEs implementing GA4 without dedicated data engineering resources, the risk of misconfiguration is substantial.
A critical point that catches many teams: GA4 and Google Search Console measure organic traffic differently. GA4 excludes bot traffic automatically while GSC does not. GA4 applies customisable time zones while GSC always uses Pacific Time. GA4 uses data-driven attribution while GSC uses last-click. These differences mean GSC typically reports higher click counts than GA4 reports organic sessions, with discrepancies ranging from 10% to 40% depending on website configuration.
Google Search Console Answers
How often does Google show our content? (impressions) How often do users click from Google to our site? (clicks) What queries trigger our pages? (search queries)
Google Analytics 4 Answers
What happened after users reached our site? (engagement) Which pages drive conversions? (conversion paths) What is the quality of organic traffic? (engagement rate, session duration)
Which SEO Metrics Actually Drive Business Decisions?
The metrics that belong in your SEO reports depend on who is reading them and what decisions they need to make. We break this into three tiers: leading indicators, concurrent indicators, and business outcome metrics.
Leading Indicators: What Predicts Future Performance
Leading indicators tell you whether your SEO investment is building momentum, even before that momentum converts into revenue. These include keyword rankings for target terms, organic impressions in Google Search Console, new keyword visibility (queries you rank for that you did not rank for previously), and indexed page count. For UK B2B companies with sales cycles of six months or longer, leading indicators are particularly important because they signal future pipeline growth that will not appear in conversion data for months.
| Metric | Source | What It Tells You | Reporting Frequency |
|---|---|---|---|
| Keyword rankings | GSC / Semrush / Ahrefs | Position trends for priority keywords | Weekly |
| Organic impressions | GSC | How often Google shows your content | Monthly |
| New keyword visibility | GSC / Ahrefs | Whether you are expanding search footprint | Monthly |
| Indexed pages | GSC | Whether Google can find and store your content | Monthly |
| AI search visibility | Rankscale / SE Ranking | Whether AI engines cite your content | Monthly |
Concurrent Indicators: What Shows Current Quality
Concurrent indicators reveal whether the traffic you are receiving is actually valuable. GA4 defines an engaged session as one lasting longer than ten seconds, containing a conversion event, or including at least two page views. This is a meaningful improvement over Universal Analytics, which treated all sessions equally regardless of user behaviour.
Research from Magnet published in 2025 demonstrates that improving Core Web Vitals produces measurable engagement improvements. A 100-millisecond improvement in page load time correlates with up to 7% improvement in conversion rates. Companies implementing comprehensive Core Web Vitals optimisation saw bounce rates drop from 68% to 41%, with average session duration extending by two minutes.
The engagement metrics that matter most for UK B2B businesses are engagement rate (percentage of sessions that are engaged), average engagement time per session, pages per session for organic visitors, and scroll depth on key landing pages. These metrics help distinguish between high-intent visitors who are evaluating your services and casual browsers who will never convert — a distinction that raw traffic numbers cannot make.
For content-led businesses, tracking engagement by content type reveals which formats drive genuine interest. HubSpot's 2026 State of Marketing Report found that guides and ebooks achieve 27% success rates, webinars 26%, and roundups 26%. If your team's guides consistently outperform other formats but you are investing heavily in roundup content, your reporting framework should make this inefficiency visible.
Business Outcome Metrics: What Proves ROI
Ultimately, SEO must demonstrate business impact. The five most important metrics for marketing leaders, according to HubSpot's 2026 data, are lead quality and marketing qualified leads (39% of marketers), lead-to-customer conversion rate (34%), return on investment (31%), customer acquisition cost (30%), and lead generation volume (29%). Notice that traffic volume does not appear in this list.
| Industry | Organic Conversion Rate | Average SEO ROI | Typical ROI Timeline |
|---|---|---|---|
| Legal services | 7.5% | 526% | 6–12 months |
| B2B SaaS | ~3% | 702% | 12–36 months |
| Home services | ~2.7% | 1,990% (19.9×) | 3–6 months |
| Professional services | ~3%+ | Varies widely | 6–12 months |
| Cross-industry average | 2.7% | — | 6–12 months |
Sources: Ruler Analytics 2025, FirstPageSage 2025, CI Web Group 2025
SEO-generated leads convert at 14.6% compared to just 1.7% for outbound efforts — making organic search-acquired customers 8.5 times more likely to purchase. B2B companies generate roughly twice as much revenue from organic search compared to any other digital channel. These figures demonstrate why leading UK agencies now build reporting frameworks around revenue attribution rather than traffic volume.
How to Calculate SEO ROI Properly
The basic SEO ROI formula is straightforward: (Revenue from SEO – Cost of SEO) ÷ Cost of SEO × 100. Executing it properly is considerably harder, because it demands infrastructure that most UK SMEs lack — closed-loop revenue tracking, customer lifetime value calculation, total cost accounting, and appropriate time horizon selection.
Why Time Horizon Matters
SEO delivers ROI on a fundamentally different timeline than other marketing channels. Positive ROI typically appears 6–12 months after investment begins, with peak results emerging in the second or third year. For home service businesses, every pound spent on SEO returns £19.90 in closed revenue, compared to £4.40 for paid advertising. The cost to acquire a paying customer through SEO is £126 compared to £553 through paid ads.
However, these returns only materialise if businesses maintain investment long enough. A business evaluating SEO ROI at three months will almost always conclude it is underperforming — not because it is, but because the measurement timeline is misaligned with the channel's natural performance curve.
The Cost of Measuring Too Early
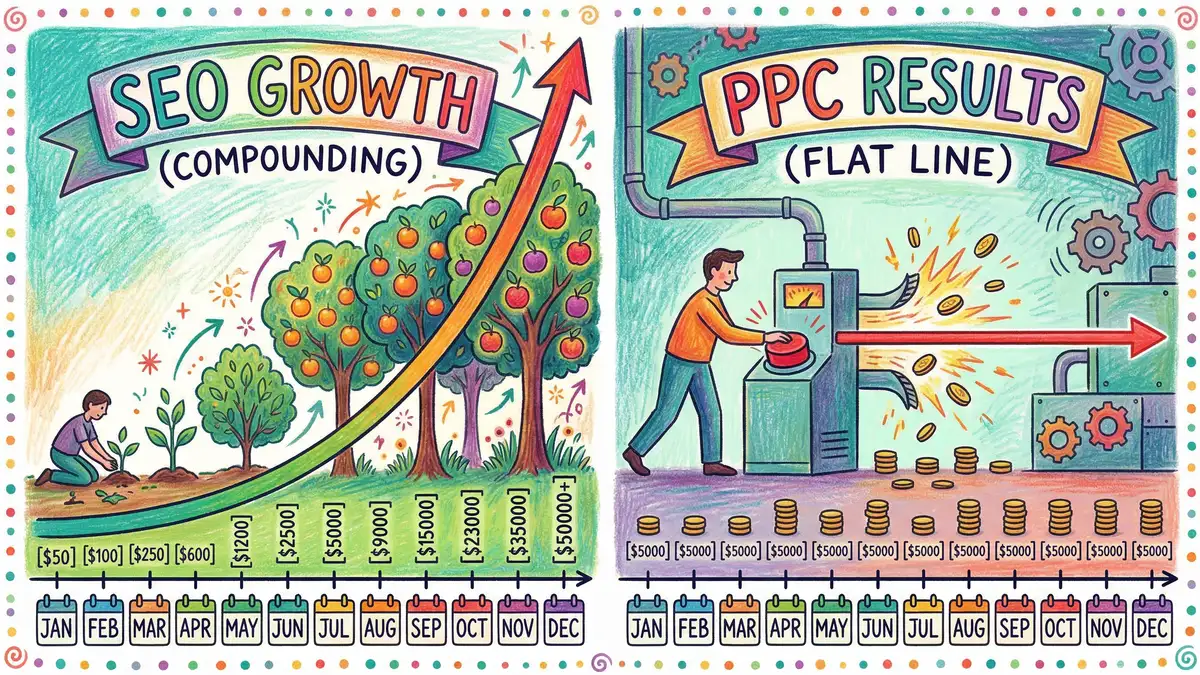
Common mistake: Evaluating SEO ROI after 3 months and concluding the investment is not working. PPC shows immediate returns, so SEO appears to underperform by comparison.
The reality: SEO ROI compounds over time. Month 1–3 typically produces no measurable traffic. Month 4–6 shows ranking improvements and modest traffic. Month 12+ is where SEO traffic exceeds PPC traffic while costs remain flat. Mature businesses typically reduce PPC spend as organic traffic builds — but only if they invested long enough to reach that point.
The Pragmatic Approach for UK SMEs
If your business lacks the CRM integration for perfect attribution, the pragmatic alternative is to establish proxy metrics that approximate ROI. Track qualified leads from organic search (leads meeting your ideal customer profile criteria), the conversion rate of those leads to customers, average contract value, and estimated customer lifetime value based on historical data. Multiply these together for an estimated SEO-sourced revenue figure, and compare it to your SEO investment for a reasonable ROI approximation.
Count Organic Qualified Leads
Use GA4 to identify form submissions, consultation requests, or phone calls from organic search visitors that meet your ideal customer profile criteria.
Apply Your Historical Conversion Rate
Calculate what percentage of similar leads have historically converted to paying customers. For B2B professional services, this is typically 15–25%.
Multiply by Customer Lifetime Value
SEO-acquired customers have an estimated 3× higher lifetime value than paid channel acquisitions. Use your average contract value multiplied by average customer lifespan for this figure.
Compare Against Total SEO Cost
Include agency fees, internal labour hours, tool subscriptions, and content production costs. Divide estimated revenue by total cost, then multiply by 100 for your ROI percentage.
How Should You Track AI Search Visibility?
Throughout 2025, AI-powered search engines operating independently from Google — primarily ChatGPT, Perplexity, Claude, and Bing with AI integration — have created an entirely new measurement category. McKinsey research indicates that approximately 44% of AI-powered search users now identify it as their primary and preferred source of insight, surpassing traditional Google search at 31%. Yet only 16% of brands systematically track their visibility across these platforms.
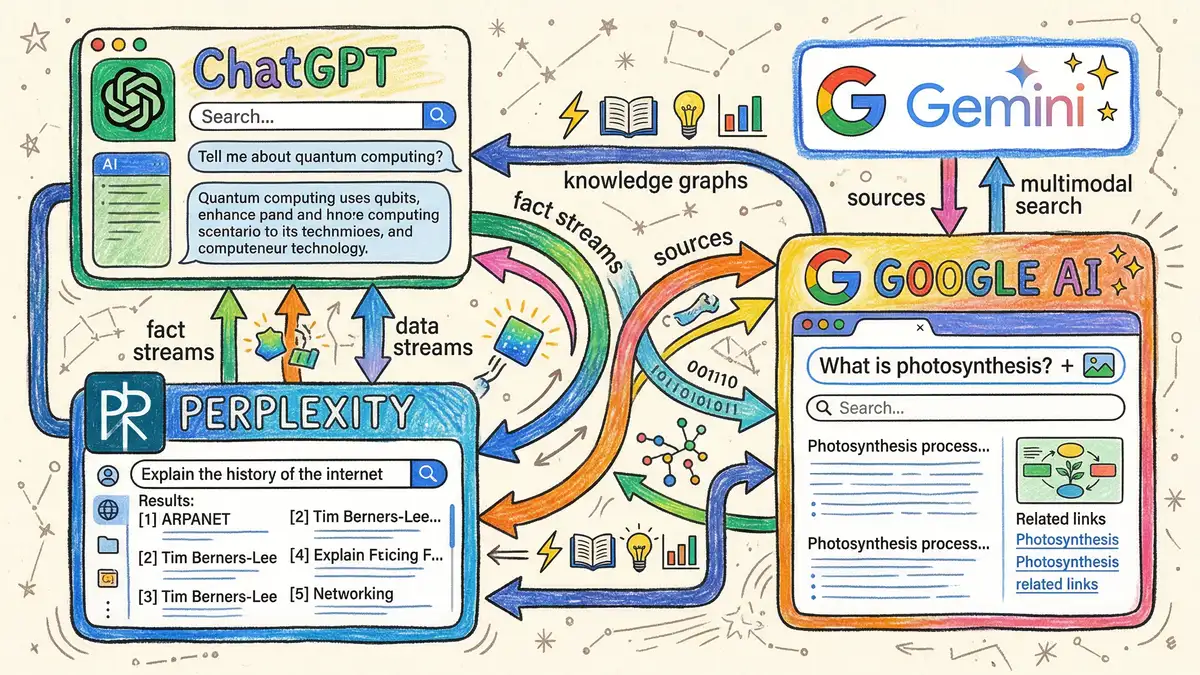
The challenge is that AI search engines operate under completely different rules. While Google's AI Overviews link to cited sources and maintain recognisable SERP mechanics, platforms like ChatGPT and Perplexity may cite your content whilst never sending a click. Appearance in AI-generated responses depends heavily on expertise, authority, and trustworthiness signals rather than traditional link equity or keyword optimisation on-page SEO optimisation.
Emerging tools designed specifically for AI search visibility tracking have begun addressing this gap. Tools like Rankscale.ai, SE Ranking's AI Overview tracker, and newer platforms including Profound and ZipTie allow brands to monitor keyword appearance across ChatGPT, Perplexity, and Google AI Overviews. These track not just whether your content appears, but where it appears within AI-generated responses, the sentiment of mentions, and citation frequency.
For UK SMEs, the practical implication is that traditional keyword ranking tracking through Google Search Console, Semrush, or Ahrefs — whilst still essential — now represents only a partial view of search visibility. A brand might rank position 1 for a target keyword in Google's organic results, achieve zero clicks due to AI Overviews, and receive no mentions in ChatGPT or Perplexity responses. This fragmentation of the search ecosystem requires measurement frameworks that aggregate visibility signals across multiple platforms simultaneously.
Google AI Overviews
Track via GSC and SE Ranking. Appearing in 13%+ of queries and growing. Links to cited sources, measurable through existing tools.
ChatGPT Search
Track via Rankscale.ai or Profound. May cite content without sending clicks. Relies on E-E-A-T signals and structured content.
Perplexity
Track via ZipTie or manual monitoring. Transparent citation system with numbered source links. Growing user base in UK market.
The Bottom Line
Content optimised with structured data markup appears 60% more frequently in AI-generated answers. For UK businesses, investing in schema markup and entity optimisation is no longer a supplementary technical enhancement — it is core SEO infrastructure that directly affects visibility across both traditional and AI-powered search.
What Tools Do UK Businesses Actually Need?
The good news: UK SMEs can build sophisticated measurement infrastructure from entirely free components. The combination of Google Analytics 4, Google Search Console, and Looker Studio provides 70–80% of essential measurement capability at zero cost. Third-party tools add incremental value through competitor benchmarking, automated rank tracking, backlink analysis, and AI visibility tracking — but these features drive measurable benefit primarily for competitive or growth-focused markets.
The Free Stack: GA4 + GSC + Looker Studio
Google Search Console provides keyword ranking data, click data, impressions, and average position metrics. GA4 captures post-click user behaviour, conversions, and engagement signals. Looker Studio can automatically visualise data from both GA4 and GSC, enabling custom dashboard creation without additional cost. For many small and mid-market UK businesses, this free stack addresses the core measurement requirements.
When Paid Tools Justify the Investment
| Tool | Starting Price (Monthly) | Key Capability Beyond Free Tools | Best For |
|---|---|---|---|
| Semrush | £139.95 | Competitor analysis, position tracking, content gap analysis | Agencies and growth-stage businesses |
| Ahrefs | £129 | Backlink analysis, technical auditing, keyword research | Technical SEO and link building focus |
| Moz | £39 | Domain authority tracking, local SEO, beginner-friendly interface | Small businesses and local SEO |
| SE Ranking | £86 | AI Overview tracking, competitive intelligence, content tools | Budget-conscious teams wanting AI visibility |
| Whatagraph | Varies | Automated reporting across 55+ platforms, AI insights | Agencies managing multiple clients |
Sources: Semrush, Ahrefs, Moz, SE Ranking pricing pages (February 2026)
For UK SMEs allocating £500–£2,000 monthly for complete SEO services choosing an SEO company, the monthly subscription cost of premium tools represents a meaningful percentage of total investment. The strategic question is whether paid tools deliver ROI proportional to their cost relative to the free stack. In most cases, the answer is yes only when the business is actively competing in high-value keyword categories where competitor intelligence and advanced technical auditing provide material strategic advantage.
AI-Powered Reporting Automation
A new category of AI-powered analytics tools has emerged with explicit focus on eliminating manual reporting bottlenecks. Adobe research from 2025 reveals the underlying challenge: 96% of marketing professionals reported experiencing a 2× or greater increase in content demand over two years, and 58% report that more than 40% of their operational time is consumed by content reviews and approvals rather than strategic work.

When a marketing manager is spending 20–25% of allocated hours compiling SEO reports rather than analysing performance or developing strategy, that represents direct financial waste. Tools like Whatagraph and DashThis can reduce weekly reporting time from 8–10 hours to 1–2 hours by automating data gathering, visualisation, and preliminary insight generation. This efficiency gain becomes even more valuable when combined with AI-assisted data interpretation, allowing marketers to generate actionable insights faster.
How to Structure SEO Reports That Drive Action
The difference between a useful SEO report and a vanity exercise comes down to three principles: goal alignment, contextual interpretation, and audience-appropriate communication.
Goal Alignment
Every metric in your report must connect directly to a business objective. If a metric does not help someone make a decision, it does not belong in the report. This is why traffic volume, on its own, is insufficient — it answers "how many people visited?" but not "did those visits generate business value?" Effective reports pair visibility metrics with engagement and conversion data to tell a complete story.
Contextual Interpretation
Metrics without context are dangerous. If organic clicks decreased last month, the report must explain why. Did Google begin showing AI Overviews for 30% of your target keywords, reducing organic CTR by an average of 15 percentage points? That is not a failure of your SEO — it is a structural shift in search behaviour requiring measurement approach changes. This contextual framing transforms a potential crisis into an analytical insight and charts the path forward.
Audience-Appropriate Communication
Reports should be tailored to their audience. The executive summary presented to business leadership should focus exclusively on business metrics: conversions, revenue, customer acquisition cost, customer lifetime value. Technical details about keyword rankings, backlink profiles, or Core Web Vitals belong in supplementary sections for specialists. When reports prioritise metrics aligned to business goals, stakeholder engagement with reports nearly doubles compared to reports emphasising technical SEO metrics.
| Report Cadence | Audience | Metrics Focus | Purpose |
|---|---|---|---|
| Weekly pulse | SEO/marketing team | Priority keyword rankings, major traffic movements, technical errors | Tactical course correction |
| Monthly report | Marketing leadership | All standard metrics with context and trend analysis | Performance assessment and optimisation |
| Quarterly review | Business leadership / C-suite | Revenue attribution, ROI, CAC, LTV, competitive positioning | Strategic evaluation and budget decisions |
How Does GDPR Affect SEO Analytics in the UK?
UK businesses face a particular challenge at the intersection of privacy regulation and analytics capability. GA4 can operate in GDPR-compliant mode, but only when specific configurations are implemented correctly — IP anonymisation, explicit data retention policies, cookie consent management aligned to Consent Mode, and Data Processing Agreements with Google.
The practical problem is that many UK SMEs find themselves unable to implement full-featured GA4 attribution because visitor cookie consent rates are too low to generate statistically significant model training data. This creates a measurement paradox: improving privacy compliance (respecting user refusal to be tracked) necessarily degrades measurement capability.
The response, as documented in Supermetrics' 2026 Marketing Data Report, is measurement triangulation — using GA4's data-driven attribution as one signal, last-click attribution from GSC as a second signal, and platform-specific tracking as a third signal, then making decisions only when multiple signals align. This acknowledges that no single attribution model provides perfect accuracy and builds decision-making resilience by requiring corroboration before major resource allocation changes.
On AI crawler access, approximately 32% of UK website owners permit AI platforms full access to their content for training and citation, 29% restrict specific platforms, and 11% completely block AI scrapers. This distribution reflects genuine uncertainty about optimal strategies. Our recommendation: allow AI crawlers access unless you have specific intellectual property concerns. Non-appearance in AI search systems represents a visibility cost that typically exceeds the data protection benefit for most B2B businesses.
Building Your SEO Analytics Framework: A Practical Starting Point
If you are starting from scratch or rebuilding a measurement framework that no longer reflects how search works, here is the approach we recommend for UK B2B businesses.
61%
GA4 Adoption
UK marketing professionals using GA4 (Jan 2026)
14.6%
SEO Lead Conversion
Organic leads converting vs 1.7% outbound
8.5×
Purchase Likelihood
SEO-acquired vs outbound-acquired customers
Sources: MarTech Alliance January 2026, Ruler Analytics 2025, FirstPageSage 2025
Start with the free stack (GA4 + GSC + Looker Studio) configured correctly. Ensure GA4 is set up with proper event tracking, conversion definitions, and GDPR-compliant consent management. Verify that GSC is connected and showing data for your primary domain. Build a Looker Studio dashboard that combines data from both sources into a single view.
Next, define your metric hierarchy. Separate leading indicators (rankings, impressions, visibility) from concurrent indicators (engagement rate, session quality) from business outcomes (conversions, revenue, CAC). Map each metric to a specific decision it informs and a specific stakeholder who needs it.
Finally, establish a reporting cadence: weekly pulse checks for your SEO team, monthly comprehensive reports for marketing leadership, and quarterly business reviews connecting SEO to revenue for senior stakeholders. Maintain consistency even when results are unfavourable — inconsistent or selective reporting rapidly erodes credibility and prevents stakeholders from developing confidence in performance trends.
For businesses ready to move beyond the free stack, consider adding AI search visibility tracking (SE Ranking or Rankscale.ai) and competitive intelligence (Semrush or Ahrefs) as targeted investments. These tools justify their cost when your market is competitive and the insights they provide directly inform strategy decisions.
Frequently Asked Questions
What is the most important SEO metric for UK businesses in 2026?
No single metric captures the full picture. The most effective approach is a three-tier framework combining leading indicators (keyword rankings, organic impressions), concurrent indicators (engagement rate, session quality), and business outcome metrics (conversions, revenue attribution, customer acquisition cost). For B2B businesses with longer sales cycles, leading indicators are particularly important because they signal pipeline growth months before conversions appear.
How often should I produce SEO reports?
The optimal approach involves layered reporting: weekly pulse checks on critical metrics for your SEO team, monthly comprehensive reporting across all standard metrics for marketing leadership, and quarterly strategic business reviews connecting SEO to broader business performance for senior stakeholders. This prevents both under-communication (where stakeholders disengage) and over-communication (where daily metric fluctuations cause decision-making paralysis).
Can I track whether AI search engines cite my content?
Yes, though the tooling is still emerging. Platforms like Rankscale.ai, SE Ranking's AI Overview tracker, Profound, and ZipTie monitor keyword appearance across ChatGPT, Perplexity, Google AI Overviews, and other AI search systems. These tools track appearance, position within AI responses, sentiment of mentions, and citation frequency. Only 16% of brands currently track AI search visibility systematically, making this a competitive advantage for early adopters.
How long does it take to see ROI from SEO?
Positive SEO ROI typically appears 6–12 months after investment begins, with peak results in the second or third year. This timeline differs fundamentally from paid advertising, which delivers immediate results. For UK B2B SaaS companies, average SEO ROI reaches 702% over 1–3 years. For legal services, it reaches approximately 526%. The key is maintaining investment long enough for compounding returns to materialise.
Is Google Analytics 4 GDPR compliant?
GA4 can operate in GDPR-compliant mode when configured correctly. This requires IP anonymisation, explicit data retention policies, cookie consent management aligned to Google's Consent Mode, and a Data Processing Agreement with Google. Many UK SMEs struggle with implementation because visitor cookie consent rates remain too low to generate statistically significant attribution model training data. The practical solution is measurement triangulation — using multiple data sources rather than relying on any single attribution model.
Should I block AI crawlers from accessing my website?
For most UK B2B businesses, blocking AI crawlers reduces search visibility without proportional data protection benefit. Approximately 32% of UK website owners allow full AI access, 29% restrict specific platforms, and 11% completely block AI scrapers. We recommend allowing access unless you have specific intellectual property concerns, as non-appearance in AI search results is increasingly costly as these platforms grow in user adoption.