PPC management WordStream PPC best practices is the ongoing process of planning, launching, monitoring and optimising paid search campaigns to maximise return on ad spend. For UK B2B companies in 2026, effective PPC management means structuring Google Ads Google Ads help center and Microsoft Ads campaigns around sound unit economics, implementing closed-loop attribution that connects clicks to closed revenue, and using smart bidding strategies with enough conversion data for algorithms to learn. The average UK agency charges £1,000–£1,600 per month for PPC management, while in-house teams cost £75,000–£100,000 annually when you factor in salary, tools and training.
If you have ever launched a Google Ads campaign and watched your budget evaporate with little to show for it, you are not alone. Research from 1,306 PPC professionals worldwide shows that 72% of B2B marketers still report opaque attribution that prevents intelligent budget reallocation. The problem is rarely that PPC itself does not work — it is that most campaigns are built around arbitrary budgets rather than the economic logic that determines whether each click can actually generate profitable revenue.
This guide breaks down what professional PPC management involves, what it costs in the UK market, and how to structure campaigns that connect ad spend to real business outcomes. Whether you are evaluating PPC agencies or considering bringing management in-house, you will find the data and frameworks needed to make an informed decision.
What Does PPC Management Actually Involve?
PPC management covers far more than pressing "go" on an ad campaign. It is an ongoing discipline that spans strategic planning, technical implementation and continuous optimisation. Here is what the process looks like when done properly.
Build atomic keyword lists organised by services, modifiers and locations. Structure campaigns with separate exact match (60–70% budget) and phrase match (25–30% budget) campaigns, reserving 5–10% for testing new keyword opportunities.
Create ad groups with tightly themed keywords, write ad copy that matches search intent precisely, and set up conversion tracking across all platforms. Implement enhanced conversions with hashed first-party data for better match rates.
Choose between Target CPA, Target ROAS or Maximise Conversions based on your conversion volume. Smart bidding requires a minimum of 30–50 conversions per month per campaign to optimise effectively.
Ensure message consistency between ad copy and landing page content. Remove unnecessary navigation (studies show this can increase conversions by up to 336%), use a single clear call-to-action, and test variations to find what converts.
Review search term reports weekly, add negative keywords to prevent wasted spend, adjust bids based on performance data, test new ad variations, and feed CRM conversion data back to the ad platform for closed-loop optimisation.
The critical difference between amateur and professional PPC management is that final step — the feedback loop. Without connecting your ad platform to your CRM, you are optimising for clicks and form fills rather than actual revenue. We see this consistently across the accounts we manage: campaigns that appear to underperform on surface metrics often contribute meaningfully to revenue when attribution is measured properly.
How Much Does PPC Management Cost in the UK?
Understanding UK PPC costs requires separating two distinct budgets: the management fee (what you pay someone to run campaigns) and the media spend (what you pay Google or Microsoft for clicks). Here is what the 2026 UK market looks like.
| Pricing Model | Typical UK Cost | Best For | Watch Out For |
|---|---|---|---|
| Monthly retainer | £1,000–£1,600/month | Predictable costs, ongoing management | Scope creep — define deliverables upfront |
| Percentage of spend | 10–15% of ad budget | Large budgets where scaling is the priority | Incentivises agencies to increase spend, not efficiency |
| Performance-based | Varies by KPI agreement | Companies with clear attribution and CRM data | Requires robust tracking — disputes arise without it |
| Project-based | £2,000–£5,000 per project | Account audits, strategy development, setup | No ongoing optimisation included |
The monthly retainer model dominates the UK market, with 78% of UK agencies using it as their primary pricing structure. When evaluating proposals, always ask for management fees and media spend to be itemised separately. An agency quoting "£3,000 per month all-in" gives you no visibility into how much is actually going toward clicks versus management overhead. For a detailed breakdown of digital marketing costs, see our UK pricing guide.
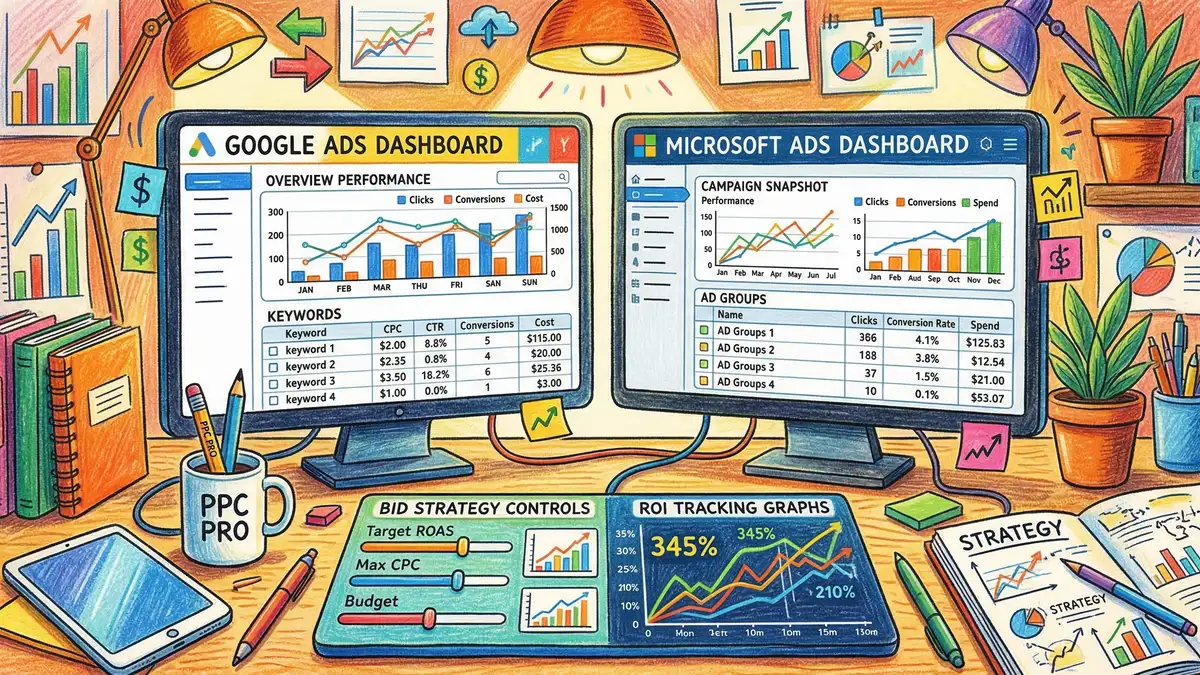
How Should You Structure Google Ads Campaigns for B2B?
Campaign structure determines whether your budget reaches high-intent prospects or gets diluted across irrelevant searches. The foundation is aligning structure to business objectives rather than accepting platform defaults.
Key Takeaway
Allocate 60–70% of budget to exact match campaigns where intent is highest, 25–30% to phrase match for relevant long-tail variations, and 5–10% to testing new keyword opportunities. This structure ensures your highest-converting traffic gets the most budget while still capturing emerging opportunities.
The most important structural decision is separating brand campaigns from non-brand campaigns. Brand traffic (people searching your company name) converts at dramatically different rates than category or competitor keywords. Mixing them in a single campaign makes it impossible to identify where profitability actually lies. A search for "company name + pricing" might convert at 15%, while a generic "ppc management services" search converts at 3% — if these are in the same campaign, your aggregate 9% conversion rate tells you nothing useful.
Within non-brand campaigns, segment by keyword intent. Solution keywords ("ppc management software") carry different intent than awareness keywords ("what is ppc management"), and they should have separate budgets, bids and landing pages. This mirrors the principle we apply across PPC and SEO strategies — matching content to search intent is what drives conversions, regardless of channel.
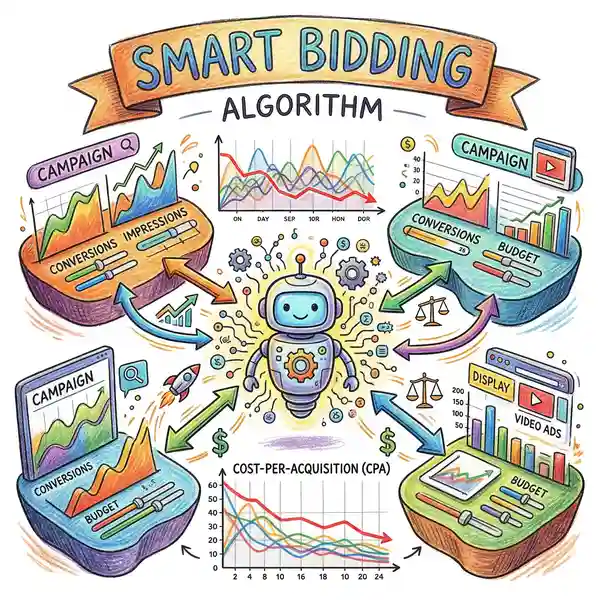
Smart Bidding: Which Strategy Fits Your Business?
| Bid Strategy | Minimum Conversions Needed | Best For | Risk Level |
|---|---|---|---|
| Target CPA | 30–50 per month per campaign | Stable conversion values, clear cost targets | Medium |
| Target ROAS | 30–50 per month per campaign | Variable deal values, revenue-focused optimisation | Medium |
| Maximise Conversions | 15–20 per month per campaign | Growth phases, new campaigns building data | Higher |
| Manual CPC | No minimum | Very small budgets, niche keywords, testing | Lower cost risk |
A common trap in B2B PPC management is setting budgets too low for smart bidding to function. If your Target CPA is £50 and your daily budget is £30, the algorithm cannot generate enough conversions to learn. Set daily budgets at 3–5 times your target CPA to give the algorithm room to optimise. It feels counterintuitive to spend more during the learning phase, but campaigns that underspend during learning often never reach their potential.
Why Should You Consider Microsoft Ads for B2B PPC?
Microsoft Advertising remains the most underexploited opportunity in UK B2B paid search. The data makes a compelling case for diversifying beyond Google-only strategies.
The demographics explain the performance advantage. Microsoft's audience skews older, higher-income and overwhelmingly desktop-based — precisely the profile of enterprise decision-makers searching during business hours on corporate Windows machines. More importantly, Microsoft has integrated LinkedIn profile targeting directly into its ad platform, letting you target by industry, job function, company size and seniority while paying dramatically less per click than Google. See our detailed guide to PPC for accountants for sector-specific campaign structures and benchmarks.
The practical implementation framework is straightforward: allocate 10–25% of your total paid search budget to Microsoft Ads alongside your existing Google campaigns. Many companies accelerate setup by importing Google campaigns directly into the Microsoft interface. After 30 days of data, evaluate whether the projected CPA reduction materialises. If it does, gradually shift allocation toward 25–30%. The key principle is diversification — reducing dependence on a single platform protects against sudden algorithm changes or auction density increases.
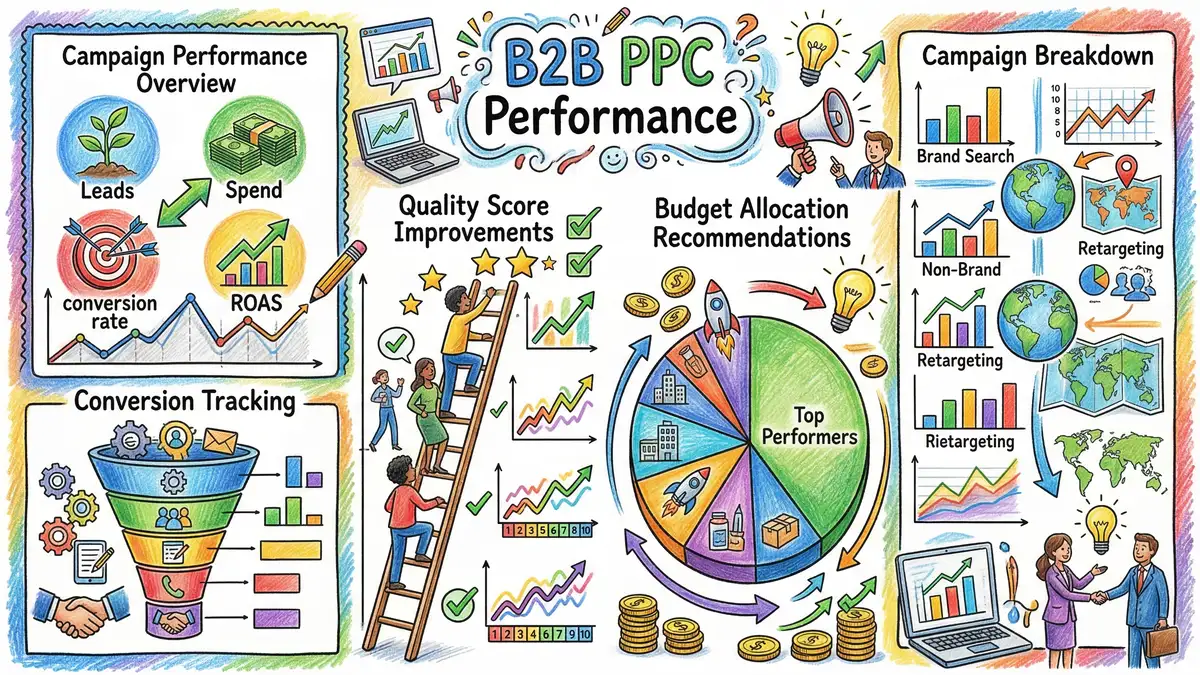
How Do You Measure PPC ROI for B2B?
The Cost of Getting It Wrong
Last-click attribution — the default in most ad platforms — assigns 100% of revenue credit to the final touchpoint before conversion. In B2B where the average buyer journey spans 272 days, this means your awareness campaigns appear to generate zero revenue while your bottom-funnel campaigns appear wildly profitable. The result: marketing teams systematically underfund the top of the funnel, creating a pipeline crisis 6–12 months later when prospects stop entering the buying journey.
The fundamental challenge in B2B PPC measurement is connecting ad clicks to closed revenue across sales cycles that typically span 6–12 months. A prospect might see a LinkedIn ad in January, click a Google search ad in April, receive email nurture through May and close as a customer in July. Last-click attribution would give 100% credit to the email — and 0% to the ads that introduced and re-engaged the prospect.
Solving this requires closed-loop reporting that connects three systems: your ad platform (Google Ads, Microsoft Ads), your analytics platform (Google Analytics 4), and your CRM (HubSpot, Salesforce, or similar). When a prospect clicks an ad, their click is tracked via GCLID. When they fill a form, that submission creates a CRM lead record tagged with the GCLID. As the lead moves through your pipeline — MQL, SQL, opportunity, closed-won — each stage transition can be sent back to the ad platform via offline conversion uploads.
This creates a complete feedback loop where the ad platform can see which campaigns generated not just form fills, but qualified opportunities and closed deals. Google's Enhanced Conversions feature facilitates this by matching hashed first-party customer data against its signed-in user database, connecting conversions even when traditional cookie tracking fails.
The ROAS Framework for B2B
Return on ad spend should be calculated as revenue generated divided by total ad spend (including management fees), not simply conversion count divided by spend. Consider this example: a campaign generates 100 leads at £50 CPL (£5,000 total spend). If those leads close at 20% with £100,000 average lifetime value, your ROAS is (20 × £100,000) ÷ £5,000 = 400%. If they close at just 2%, your ROAS drops to 40%. The ad platform cannot distinguish between these scenarios unless you feed it closed-revenue data.
For a practical guide to auditing whether your campaigns are tracking correctly, see our PPC audit guide.
What Are the Most Common PPC Management Mistakes?
After reviewing hundreds of B2B ad accounts, certain patterns of wasted spend appear consistently. Here are the mistakes that cost UK businesses the most money.
Starting with budget rather than economics. The most fundamental mistake is structuring campaigns around an arbitrary monthly budget rather than calculating what you can afford per acquisition. Work backward from your gross margin, target LTV:CAC ratio (3:1 is the gold standard), and pipeline conversion rates to determine your allowable cost per lead — then set budgets accordingly.
Poor conversion tracking. Approximately 50% of B2B companies have material gaps between conversions recorded in Google Ads and actual conversions in their CRM. This is typically caused by form tracking failures, cross-domain issues or missing offline conversion imports. If you cannot verify that your conversion tracking fires correctly using Google Tag Assistant, your optimisation decisions are based on incomplete data.
Ignoring Microsoft Ads. Many UK practitioners still dismiss Bing as irrelevant despite clear 2026 data showing 49% CPC reduction and 20% lower cost-per-acquisition when deployed alongside Google campaigns. The opportunity cost is material: the same customer at £0.72 CPC versus £1.42 on Google represents a 50% saving that compounds across every click.
Landing page disconnect. Poor landing page experience remains one of the most persistent drivers of wasted PPC spend. Ad copy promising a free demo that links to a generic homepage, excessive navigation creating decision paralysis, or unclear calls-to-action — these friction points mean you are paying for clicks that never convert. A/B testing landing pages typically yields 10–30% conversion improvement without any change to media spending.
Insufficient budget for algorithm learning. Setting a daily budget below 3 times your target CPA starves the algorithm of conversion data. Campaigns that cannot generate at least 30 conversions per month will underperform because the machine learning has insufficient data to learn what works. The counterintuitive solution is to increase budget during the learning phase, not decrease it.
Agency vs In-House PPC Management: Which Model Works Best?
The choice between outsourced and in-house PPC management depends on more than cost — it hinges on data access, strategic control, and the complexity of your sales funnel.
| Factor | Agency Model | In-House Model | Hybrid Model |
|---|---|---|---|
| Annual cost | £14,400–£19,200 | £75,000–£100,000 | £30,000–£48,000 |
| Data access | Limited — depends on client sharing CRM data | Full — direct CRM and pipeline access | Full — specialist embedded in your systems |
| Strategic depth | Shared across multiple clients | Dedicated to your business | Dedicated strategy, outsourced execution |
| Scalability | Fast — agency has team depth | Slow — requires hiring | Medium — can flex agency scope |
| Best for | Spend under £10k/month, standard funnels | Spend over £25k/month, complex attribution | £10k–£50k/month, CRM-heavy strategies |
The hybrid model is emerging as the optimal choice for mid-market B2B companies. A fractional PPC specialist working 2–3 days per week (£2,000–£3,000/month) handles strategy, conversion tracking and CRM integration, while an agency partner manages day-to-day bid optimisation, creative testing and reporting (£500–£1,000/month). This preserves the data advantage of in-house management while reducing cost and headcount risk.
If you are leaning toward the agency route, our comparison of the best PPC agencies in the UK evaluates the top options by specialisation, pricing model and B2B track record. For those exploring the tools that support either approach, see our guide to PPC bid and campaign management tools.
What PPC Trends Should You Watch in 2026?
Three developments are reshaping UK PPC management this year, and they all demand attention.
Google's cross-channel campaign type is more capable in 2026 but still requires careful deployment. Use PMAX for new customer acquisition and launches — not as a replacement for high-performing brand search campaigns. Protect brand keywords with negative keyword lists to prevent PMAX from cannibalising your cheapest, highest-converting traffic. Advertisers adopting at least 3 of 4 Demand Gen best practices see over 40% more conversions.
Consent Mode v2, mandatory for UK advertisers, changes how conversion data flows to Google Ads. Users who refuse cookies are modelled through machine learning rather than tracked directly. Server-side tracking and Enhanced Conversions are no longer optional — they are essential for maintaining data quality. Companies without server-side tracking are making optimisation decisions on increasingly incomplete data.
LinkedIn delivered 121% return on ad spend in 2025, outperforming Google Search (67% ROAS) and Meta (51% ROAS). The average B2B buyer journey spans 272 days from first ad exposure to deal closure, and LinkedIn's ability to target decision-makers by job title, company size and industry makes it the most effective platform for reaching enterprise buyers early in that journey. The cost per company influenced dropped 54% year-on-year to €70.11, though cost per individual contact rose 89% — reflecting the reality that winning B2B deals requires reaching buying committees, not individuals.
Key Takeaway
The winning PPC strategy for UK B2B companies in 2026 is a three-platform approach: 60–70% budget on Google Ads for volume and reach, 20–25% on LinkedIn Ads for precision account-based targeting, and 10–15% on Microsoft Ads for cost-efficient enterprise traffic. This diversification protects against single-platform risk while capturing the unique strengths of each channel.
Frequently Asked Questions
What is a good ROAS for B2B PPC campaigns?
A good ROAS for B2B depends entirely on your unit economics. LinkedIn Ads benchmarked at 121% ROAS in 2025 using data-driven attribution over 12 months. Google Search fell to 67% ROAS. However, these figures are averages — companies with strong CRM integration and proper attribution typically achieve 200–400% ROAS on their best-performing campaigns. The gold standard is an LTV:CAC ratio of 3:1, meaning every pound spent on acquisition should return three pounds in lifetime customer value.
How long does it take for PPC campaigns to produce results?
Most Google Ads campaigns need 30–90 days to move through the learning phase, during which smart bidding algorithms gather sufficient conversion data (30–50 conversions per campaign) to optimise effectively. Initial leads may come within days of launch, but true performance optimisation — where cost per acquisition stabilises and you can confidently scale budget — typically takes 3–6 months. The B2B buyer journey itself averages 272 days, so connecting PPC to closed revenue requires even longer time horizons.
Should I manage PPC in-house or hire an agency?
The answer depends on your ad spend and data complexity. For budgets under £10,000 per month with straightforward conversion funnels, an agency at £1,000–£1,600 per month is cost-effective. For budgets above £25,000 per month with complex attribution needs, in-house management (£75,000–£100,000 annually) provides the data access advantage needed for CRM-integrated optimisation. The emerging hybrid model — fractional specialist plus agency execution at £2,500–£4,000 per month — suits the middle ground well.
What is Google Consent Mode v2 and do I need it?
Consent Mode v2 is mandatory for all UK and EU advertisers. It manages how conversion tracking works based on user cookie consent choices. Users who accept cookies are tracked normally; users who refuse are modelled through machine learning. Without Consent Mode v2, your conversion data becomes increasingly inaccurate as more users refuse cookies, meaning your bid optimisation decisions are based on a shrinking and potentially unrepresentative sample of your actual conversions.
How much should I spend on PPC as a B2B company?
Work backward from your target acquisition cost rather than picking an arbitrary budget. Calculate your average customer lifetime value, set a target LTV:CAC ratio of 3:1, determine your pipeline conversion rates (MQL to SQL to close), and you will arrive at an allowable cost per lead. Multiply that by the number of leads you need per month to hit revenue targets. For most UK B2B SMEs, this calculation produces a monthly ad spend of £3,000–£15,000, though it varies significantly by industry, deal size and conversion rates.