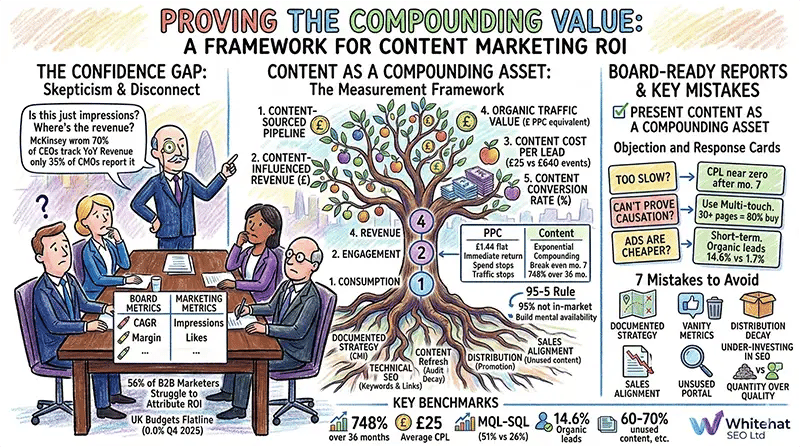
Content marketing generates 3x more leads at 62% lower cost than traditional marketing, breaks even by month seven, and delivers approximately 748% ROI over 36 months — yet 56% of B2B marketers struggle to prove this to their board. The problem is not that content marketing lacks ROI. The problem is that most marketing teams measure the wrong things, use attribution models that systematically undervalue content, and present results in a language boards do not speak. This guide from Whitehat SEO provides a practical framework for measuring content ROI, building board-ready reports, and defending your content investment with the financial evidence your CFO needs to see.
Why Your Board Is Sceptical About Content Marketing
The confidence gap between what marketers believe about content and what boards will fund has never been wider. The Content Marketing Institute's B2B Report for 2025 found that 56% of B2B marketers struggle to attribute ROI to content efforts, and only 51% believe they measure content performance effectively — despite 96% saying they measure it at all. The disconnect is not about whether measurement happens. It is about whether it convinces anyone with budget authority.
UK marketing budgets are under real pressure. The IPA Bellwether Report showed UK marketing budgets fell for the first time in four years in Q1 2025, with a net balance of -4.8%. While budgets bounced back modestly in Q2 (+5.5%) and Q3 (+3.6%), Q4 2025 flatlined at exactly 0.0%. The growth that did occur was driven by short-term sales promotions and direct marketing — not content or brand investment. Globally, Gartner's 2025 CMO Spend Survey found marketing budgets have flatlined at 7.7% of total company revenue, down from 11% pre-pandemic, with paid media the only category growing.
The metrics misalignment between marketing and the C-suite explains why content is always first on the chopping block. McKinsey's 2024 CMO Growth Research Survey found that 70% of CEOs measure marketing's impact by year-on-year revenue growth and margin, but only 35% of CMOs track these as a top metric. When marketing and the board speak different languages about success, content — with its long lead times and diffuse attribution — suffers most. Marketing Week's 2025 Career and Salary Survey of 3,500 UK respondents found that 73% of UK CMOs believe their businesses undervalue marketing strategy, for the third consecutive year.
56%
of B2B marketers struggle to attribute content ROI (CMI 2025)
73%
of UK CMOs say their businesses undervalue marketing (Marketing Week 2025)
7.7%
Marketing budget as % of revenue — down from 11% pre-pandemic (Gartner 2025)
What Content Marketing ROI Actually Means (and Why Quarterly Comparisons Mislead)
The formula is simple: ROI equals revenue minus cost, divided by cost, multiplied by 100. A £10,000 content programme generating £35,000 in attributable revenue delivers 250% ROI. The difficulty lies entirely in accurately capturing both sides — particularly revenue, where content's influence is distributed across touchpoints, time periods, and buying committee members. Most organisations only attempt to measure direct last-touch revenue attribution, leaving the majority of content's value invisible to the board.
The defining economic advantage of content over paid media is compounding returns. Paid advertising operates linearly — spend stops, traffic stops. Content, once published and ranking, continues generating traffic and leads at zero marginal cost. HubSpot's analysis of 15,000+ companies found that 10% of blog posts are "compounding" — generating increasing traffic over time — and these posts produce 38% of total blog traffic. Comparing content ROI to PPC ROI on a quarterly basis is therefore fundamentally misleading. PPC delivers immediate but flat returns of approximately £1.44 per £1 spent. Content breaks even around month seven, then accelerates: approximately 300% ROI by month twelve, 700% by month twenty-four, and exceeding 1,100% by month thirty-six (Directive Consulting).
Paid Media (PPC)
Returns immediately but linearly: approximately £1.44 per £1 spent, flat forever. When you stop paying, traffic stops instantly. Ad costs increase annually. Events and trade shows cost approximately £640 per lead.
Content Marketing (SEO + Content)
Breaks even by month seven, then compounds: approximately 300% ROI by month twelve, 748% over 36 months. SEO and content cost approximately £25 per lead. Organic leads close at 14.6% versus 1.7% for outbound.
Content as a Cost Reducer Across the Business
Beyond revenue generation, content reduces costs in three measurable ways. First, sales cycle compression: B2B companies using transparent, answer-led content report that prospects arrive pre-qualified. Marcus Sheridan's River Pools found visitors who read 30+ pages of content bought 80% of the time. Second, support cost reduction: a well-developed knowledge base can reduce support tickets by 40-60% (Screendesk 2025) — if a single FAQ article deflects 100 tickets per month at £12 per ticket, that represents £1,200 per month in avoided cost from one piece of content. Third, customer retention: customers acquired through content marketing are 131% more likely to return, and brands using post-purchase content retain 15-30% more customers (ProfitWell). The LinkedIn B2B Institute's 95-5 rule provides essential context: only 5% of B2B buyers are in-market at any given time, and 90% choose a vendor from their day-one shortlist (Harvard Business Review). Content's primary job is building mental availability with the 95% who will buy eventually.
What Content Marketing Actually Costs in the UK
An honest ROI calculation requires an honest cost picture — including the hidden costs that most budgets miss. The figures below reflect UK market rates for 2024-2025, drawn from salary surveys, agency pricing data, and freelance rate studies. Understanding the true cost base is essential for presenting credible numbers to your board. See Whitehat's SEO pricing guide for specific service costs.
| Content Type | UK Cost Range | Notes |
|---|---|---|
| Blog post (1,000-1,500 words) | £150–£500 | Freelance; SEO-optimised or specialist higher |
| Pillar page (3,000-5,000 words) | £500–£3,000 | Includes SEO strategy; agency with design at upper end |
| Case study | £500–£3,000 | Includes interviews; agency with design at upper end |
| White paper / eBook | £2,500–£15,000+ | Writer only at lower end; full-service agency at upper |
| Corporate video (2-3 min) | £2,000–£10,000 | Typical mid-range £4,800; animated explainer £3,000-£7,000 |
A mid-level in-house content team (writer, strategist, designer, part-time video producer) costs approximately £120,000 to £160,000 in annual salary before employer National Insurance contributions, pension, and benefits — which typically add 15-20%. The ProCopywriters Survey 2024 (422 UK copywriters) found an average freelance copywriter day rate of £440, with senior and specialist rates reaching £800 to £2,000+ per day. UK agency content retainers run from £1,250 to £3,500 per month for boutique agencies, £3,500 to £8,000 for mid-tier, and £8,000 to £16,750+ for enterprise-level full service.
The hidden costs boards do not account for are often the most significant. Subject matter expert time adds £100 to £160 per piece in hidden labour for interviews and reviews. Legal and compliance review in regulated industries can add one to four weeks per piece. One tracked case found 20% of a small marketing team's working time was spent liaising between stakeholders and agencies — equivalent to an additional full-time salary (Simple.io). A realistic total cost of ownership for a mid-tier UK content operation — in-house team, freelance support, technology stack, and distribution — runs at £150,000 to £250,000+ annually. Presenting this figure honestly to your board builds credibility rather than undermining it.
How to Measure Content Marketing ROI: A Four-Stage Framework
The most practical measurement framework tracks content impact through four progressive stages: consumption, engagement, lead generation, and revenue. Each stage has distinct metrics, and the critical discipline is connecting them into a single pipeline view — not reporting each in isolation. Robert Rose (CMI Chief Strategy Advisor) recommends organising these into three reporting tiers: primary indicators for the C-suite (converted leads, cost per lead, pipeline contribution), secondary indicators for managers (subscribers, incremental leads, traffic), and user indicators for analytics teams (engagement rates, SEO rankings, production costs).
1. Consumption
Unique visitors, page views, time on page, scroll depth, downloads
2. Engagement
Return visits, pages per session, social shares, email sign-ups
3. Lead Generation
Form fills, MQLs, content-attributed leads, conversion rate by asset
4. Revenue
SQLs, pipeline value influenced, closed-won revenue, customer LTV
Setting Up Content Attribution in HubSpot and GA4
HubSpot provides three attribution report types: Contact Create Attribution (which marketing efforts create contacts, available on all tiers), Deal Create Attribution (which efforts create deals, Enterprise only), and Revenue Attribution (which efforts drive won revenue, Enterprise only). The Full Path model is most useful for B2B content measurement, assigning 22.5% credit to each of four key conversion points — first interaction, lead creation, deal creation, and closed-won — with the remaining 10% distributed across middle interactions. Multi-touch revenue attribution requires Marketing Hub Enterprise at approximately £2,850 per month.
In GA4, data-driven attribution is now the default model, using machine learning to assign credit based on each touchpoint's statistical contribution. Content groupings must be set up via Google Tag Manager by adding a content_group parameter to match page paths to group names. The Attribution Paths report (Advertising, Attribution, Attribution Paths) shows how content functions at different points in the buyer journey. The critical insight: 84% of B2B companies still use last-click attribution (eMarketer), which systematically undervalues content — switching to a multi-touch model will almost certainly reveal content is contributing more than current reporting shows.
B2B Content Conversion Benchmarks
| Funnel Stage | Benchmark | Source |
|---|---|---|
| Blog visitor to lead | 1.5–3% | HubSpot |
| Lead to MQL | 30–35% | SalesHive, Digital Bloom |
| MQL to SQL (SEO leads) | 51% | SalesHive 2025 |
| MQL to SQL (PPC leads) | 26% | SalesHive 2025 |
| Overall lead to customer | 2–5% | Multiple sources |
Building a Board-Ready Content ROI Report
Your quarterly content ROI report should lead with five metrics, presented in financial terms that your CFO and CEO already understand. If your current reports feature page views, social shares, or email open rates as headline numbers, you are giving your board reasons to question the investment. The companion piece to this guide — The CEO's Guide to Marketing Attribution — covers what your CEO will be looking for.
1. Content-Sourced Pipeline (£)
Total pipeline value where content was the first touch. Benchmark: 25-50% of total pipeline for marketing-led organisations (Optifai 2025). This answers the board question: "How much business did content create?"
2. Content-Influenced Revenue (£)
Closed-won revenue from deals where buyers consumed content at any stage. Typically 2-3x larger than content-sourced revenue and captures content's true economic footprint. This answers: "How much revenue did content help close?"
3. Content Cost Per Lead (£)
Total content investment divided by content-attributed leads. Compare directly to paid channel CPL to demonstrate efficiency. SEO and content CPL averages approximately £25, versus events at approximately £640 per lead (Martal Group 2026).
4. Organic Traffic Value (£)
The equivalent PPC cost of your organic traffic — calculated by multiplying each keyword's monthly organic visits by its CPC value and summing. This translates SEO investment into CFO language: "We would need to spend £X per month in Google Ads to buy this traffic." Ahrefs and Semrush automate this calculation. This is the single most effective reframing for financial stakeholders.
5. Content Conversion Rate (%)
The percentage of content consumers who take a desired action (form fill, demo request, trial sign-up). Benchmark against the 1.5-3% blog-to-lead and 6.6% landing page median rates. Track this by content type to identify which formats drive the most efficient conversions.
Present Content as an Asset, Not an Expense
The most effective reframing for CFOs is to present content as a depreciating asset with compounding returns, not a recurring expense. Use a "content vintage" cohort analysis — track content investment by quarter, then show cumulative traffic, leads, and revenue generated by each quarterly cohort over 12-24 months. This makes the compounding effect visible in exactly the way CFOs analyse capital investments. A blog post published in January that ranks well in June and continues driving leads through December has a declining cost-per-lead over its lifetime.
Neutralising the Three Main CFO Objections
"It's Too Slow"
Content's 6-12 month payback period is comparable to many SaaS customer acquisition payback periods (benchmark: 5-12 months). PPC delivers faster but linearly. After month seven, content generates leads at near-zero marginal cost. Frame it as: "We are building an asset that compounds, not renting attention that evaporates."
"You Can't Prove Causation"
Acknowledge the limitation honestly, then pivot: use multi-touch attribution to show content's contribution across the buyer journey, present correlation data such as prospects consuming 30+ pages converting at 80%, and benchmark against the 56% of marketers who cannot prove attribution at all. Position your team as ahead of the curve.
"Ads Are Cheaper"
In the short term, yes. Over 36 months, no. Organic leads close at 14.6% versus 1.7% for outbound (Intergrowth). Content-led acquisition produces 20-50% lower long-term customer acquisition cost (HubSpot). And paid media creates strategic dependency: ad costs increase annually while content's cost-per-lead decreases over time.
What Good Content ROI Looks Like: Benchmarks and Case Studies
SEO and content marketing delivers 702-748% ROI over three years — but the real proof comes from companies that have published their numbers. These case studies provide concrete evidence for board presentations. The organic-versus-paid crossover typically occurs around month seven to nine. By month twelve, organic outperforms paid by 3-4x, and after 36 months the compound advantage exceeds 7x (Directive Consulting). UK-specific data from Invoke Media confirms: PPC payback is approximately six months, SEO payback approximately fourteen months — but SEO then compounds while PPC remains flat.
748%
Content marketing ROI over 36 months (FirstPageSage)
£25
Average cost per lead from SEO/content vs £640 from events
51%
SEO lead MQL-to-SQL rate vs 26% for PPC (SalesHive 2025)
SAP generated £600,000 in revenue from £80,000 in first-year content marketing expenses — a 650% ROI. Zapier achieved 454% content marketing ROI by tracking all costs against revenue using a three-year lifetime value multiplier. Salesforce UK revamped its digital content strategy and saw an 80% increase in site traffic, with a single eBook generating approximately 10,000 downloads. River Pools and Spas — the canonical B2B content ROI case — generated £2.8 million in tracked revenue from a single blog post, later reported at £28 million+ lifetime, while cutting its advertising budget from £200,000 to £16,000 and growing sales during a recession where competitors were down 50-75%.
The compounding economics are the most powerful evidence. HubSpot's analysis of 15,000+ company blogs found that only 10% of posts are "compounding" (generating increasing traffic over time), but they generate 38% of total blog traffic. Compounding posts share common characteristics: broad tactical topics, how-to format, evergreen titles, 11-13 words in the title, and 2,000+ words. The practical lesson for your board: investing more in fewer, higher-quality, strategically chosen pieces delivers disproportionate returns compared to high-volume, low-quality production.
Seven Mistakes That Destroy Content Marketing ROI
Content marketing's ROI failures are rarely caused by content quality alone — they are caused by strategic and operational mistakes that compound over time. Fixing these is often more impactful than producing more content. If your marketing agency is not helping you avoid these pitfalls, that itself is a warning sign.
1. Publishing Without a Documented Strategy
Only 40% of B2B marketers have a documented content strategy (CMI 2024). Among the most successful, 64% do. Marketers with a documented strategy are 414% more likely to report success (CoSchedule). Content without strategy is activity without direction — and boards can tell the difference.
2. Measuring Vanity Metrics Instead of Revenue
42% of thought leadership producers measure effectiveness purely through website and social media traffic (Edelman-LinkedIn 2024) — metrics that tell you nothing about revenue impact. Only 29% can trace sales to specific content. Measuring page views without conversion tracking is like counting shop-window gazers without recording sales.
3. Not Investing in Distribution
Best-performing companies devote approximately 24% of budgets to content creation, while underperformers spend 40% on creation (Percolate). Successful companies invest proportionally more in distribution and promotion. 96.55% of all web pages get zero traffic from Google (Ahrefs, 14 billion page study). Without distribution, even excellent content goes unread.
4. Ignoring Content Decay
Content follows a predictable lifecycle: publish, build traffic, peak, decline. A 20-40% drop in organic clicks over 8-12 weeks signals decay. Algorithm updates, competitor content, shifting search intent, and outdated statistics all compound. Audit top-performing content every 6-12 months and systematically refresh — 42% of marketers say updating existing content led to successful campaigns (Semrush 2023).
5. Sales-Marketing Misalignment on Content
60-70% of content produced by B2B marketing organisations goes unused, sitting on sales portals and website shelves. 75% of content marketers forget about sales enablement when planning content (G2). Organisations with structured sales enablement achieve 49% higher win rates (Highspot) and 24% faster revenue growth. Content your sales team does not use is content with zero ROI.
6. Under-Investing in SEO
96.55% of all web pages get zero traffic from Google. 93% of content on B2B sites receives no links from other sites (CMI). Content without keyword strategy, technical optimisation, and answer engine optimisation never reaches its audience regardless of quality. SEO-generated leads convert at nearly double the rate of PPC leads — the investment in discoverability directly drives ROI.
7. Prioritising Quantity Over Quality
75% of blog posts receive fewer than 39 social shares and zero backlinks (Ahrefs). Bloggers who spend 6+ hours on a post are 56% more likely to report strong results than those who invest less (Orbit Media). The quality threshold for results now exceeds what most teams invest. Fewer, better, strategically targeted pieces consistently outperform high-volume, low-quality production.
Frequently Asked Questions About Content Marketing ROI
What is a good ROI for content marketing?
B2B content marketing delivers approximately 702-748% ROI over 36 months (FirstPageSage/Directive Consulting). Content typically breaks even around month seven and accelerates from there, reaching approximately 300% ROI by month twelve. By comparison, PPC delivers approximately £1.44 per £1 spent but remains flat. The key is measuring over the correct timeframe — quarterly comparisons systematically undervalue content's compounding returns.
How much does content marketing cost in the UK?
UK content marketing costs vary by approach. Freelance blog posts cost £150-£500 each, pillar pages £500-£3,000, and white papers £2,500-£15,000+. UK freelance copywriter day rates average £440 (ProCopywriters Survey 2024, 422 respondents). Mid-tier UK agency retainers run £3,500-£8,000 per month. A mid-level in-house content team costs approximately £120,000-£160,000 in annual salary before employer costs. A realistic total cost of ownership for a mid-tier UK content operation runs at £150,000-£250,000+ annually — see Whitehat's pricing page for specific service costs.
How long does it take for content marketing to show ROI?
Content marketing typically requires 3-6 months to show meaningful ROI, with SEO-focused content needing 6-9 months to reach full potential. B2B companies often need 12-18 months to capture the full impact. Content breaks even by approximately month seven, then compounds. This timeline is comparable to many SaaS customer acquisition payback periods (benchmark: 5-12 months). The optimal B2B budget split is 46% brand-building to 54% activation (Binet and Field for the LinkedIn B2B Institute), reflecting the reality that long-term brand effects take at least six months to build.
What metrics should I report to my board for content marketing?
Report five metrics in financial terms: content-sourced pipeline (benchmark: 25-50% of total pipeline), content-influenced revenue (typically 2-3x larger than sourced), content cost per lead (compare to paid channels), organic traffic value (equivalent PPC cost of your organic traffic), and content conversion rate (benchmark: 1.5-3% blog-to-lead). Do not lead with page views, social shares, or email open rates. Present content as a compounding asset using cohort analysis showing returns over 12-24 months — see Whitehat's companion guide, The CEO's Guide to Marketing Attribution, for what your CEO will be looking for.
Does content marketing work better than PPC for B2B lead generation?
Over the long term, yes. Content marketing costs 62% less than traditional marketing and generates 3x more leads (DemandMetric). SEO-generated leads convert from MQL to SQL at 51%, nearly double the 26% rate for PPC leads (SalesHive 2025). Organic leads close at 14.6% versus 1.7% for outbound (Intergrowth). However, PPC delivers faster results and provides immediate visibility — the optimal approach is not either-or but a combined strategy where PPC provides short-term results while content builds compounding long-term returns.
Find Out Where Your Content ROI Is Leaking
Whitehat SEO helps UK B2B companies build content programmes with measurement baked in from day one. Start with a free audit of your current content performance, attribution setup, and reporting gaps.
Methodology note: This guide is based on primary research from the Content Marketing Institute B2B Report (2024-2026, 900-1,015 respondents), IPA Bellwether Reports (Q1-Q4 2025), Gartner CMO Spend Survey (2025, n=402), McKinsey CMO Growth Research Survey (2024), Marketing Week Career and Salary Survey (2025, n=3,500 UK respondents), Edelman-LinkedIn B2B Thought Leadership Impact Report (2024, n=3,500+), HubSpot blog research (15,000+ companies), ProCopywriters Survey (2024, 422 UK respondents), and Ahrefs (14 billion page study). UK-specific data was prioritised throughout. US benchmarks are clearly labelled. ROI timelines from Directive Consulting and FirstPageSage should be treated as directional rather than definitive due to vendor origin. Published March 2026 by Whitehat SEO, a HubSpot Diamond Solutions Partner based in London.
Related Reading From Whitehat SEO
The CEO's Guide to Marketing Attribution — What your CEO will be reading: the five questions they should ask about marketing measurement.
Why Your Marketing Agency Isn't Working (and How to Fix It) — Seven warning signs of a failing agency, including vanity metrics and lack of attribution.
HubSpot for UK B2B: The Inbound Marketing Playbook — How HubSpot's attribution and reporting tools support content measurement.
The State of AI Search in UK B2B [2026 Research] — Why AI search is creating a new attribution blind spot for content marketing. marketing services